With the strange mix of market dynamics in real estate right now, it can be challenging to predict when the market will cool off based on the usual seasonal patterns. On the one hand, interest rates have spiked to their highest point in years, which should be dampening demand.
On the other hand, inventory is still near record lows, and there is so much pent-up demand and cash ready to deploy that we are still hitting new record home prices each week. The question on everyone’s mind is: how fast and how much will this market slow?
Here are four leading indicators to watch for a slowdown:
1. Rapidly rising inventory

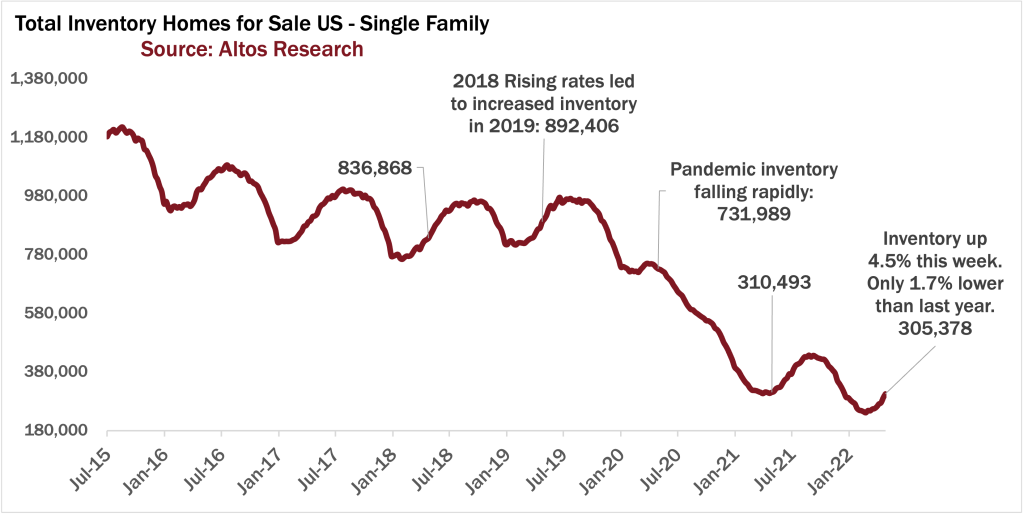
There are 305,000 single-family homes unsold on the market this week, and inventory is climbing 4-6% each week. That’s not totally unexpected for spring, but it’s a much faster pace than last year.
Our inventory forecast anticipates we’ll cross over to have more inventory than last year before the end of May. If the inventory build-up continues to accelerate, that would be a sure sign of the market in transition.
I’d anticipate we’ll end the year at maybe 390,000 homes; slightly ahead of last year, but still almost at a record low, and not anywhere near back to the normal levels of about one million homes on the market.
In fact, it will likely take several years of higher interest rates to help us build back anywhere close to the previous normal levels of active inventory. That’s a useful frame for buyers, because there are many people who are afraid to buy right now because they don’t want to buy at the peak.
2. Fewer immediate sales

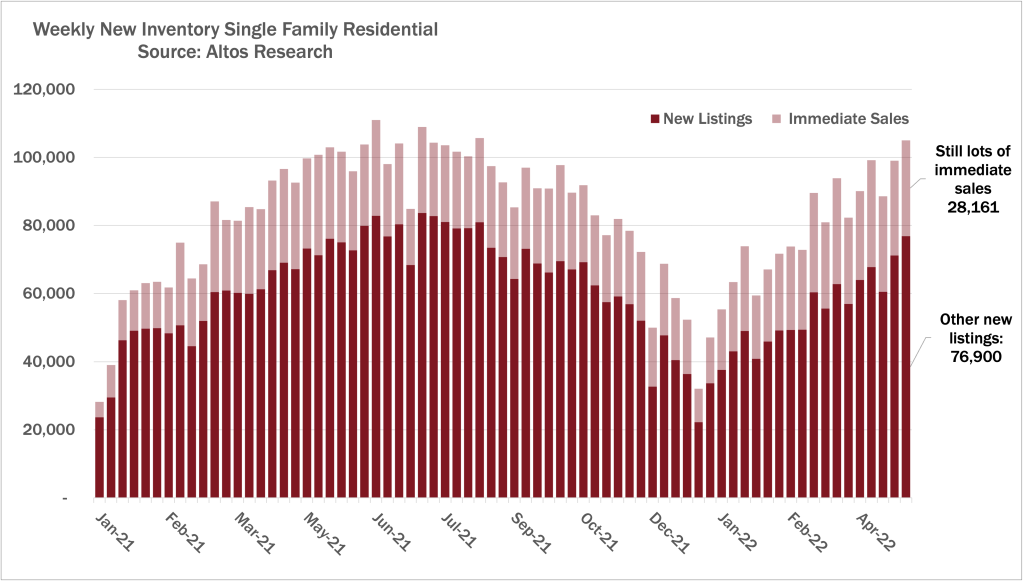
As the market has heated up over the past two years, about one-third of homes have been sold within days or even hours after hitting the market. While today’s pace is still quite robust – 27% of new listings that hit the market went into contract immediately this week – this “immediate sales” number has started slowly dropping.
Here’s what that looks like in the market: All the hot markets still have tons of bidders, but maybe they’re shifting from 50 bidders to five bidders on a property. This will still likely result in an immediate sale, but there’ll be fewer of those. For buyers and sellers, this is the number to watch for predicting how much competition there will be in the coming months. You’ll be able to see demand softening if the immediate sales rate falls quickly.
3. A sharp drop in the price of new listings

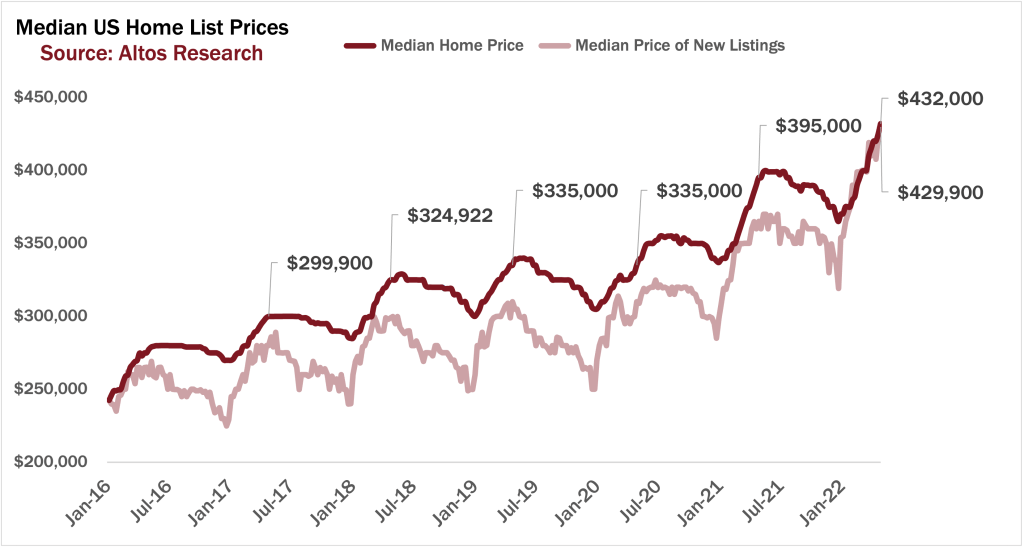
Up to this point, home prices are up. The median price of single family homes in the U.S. reached a new record high at $432,000. With the current pattern, I would expect we’ll be at about $440,000 median price by the peak of the summer. That’ll be about a 10% year-over-year gain from last year.
We’ve been watching the price of new listings each week closely, and this week the median price of those newly listed homes increased to $429,000. That shows us that buyer demand hasn’t abated, in spite of rising mortgage costs.
In normal spring and summer seasons, the price of the new listings plateaus starting in May and falls later in the year. Because the price of the new listings is a leading indicator for the market, if it starts falling sooner than July, that’d be a notable early indicator that rising rates have cooled buyer demand.
4. More price reductions

In a normal market, you’d see about 30-35% of homes take a price cut before they sell — right now, we’re at 20%. This is far fewer than in normal markets, which means that even properties that are overpriced are getting multiple offers. Many of the opportunistic sellers are saying, “well, let’s see what I get,” and are still getting their offers.
But right now price reductions are rising. Normally March is when the fewest price productions happen; as the months pass and the start of school is looming, homes that haven’t sold yet will typically take a price cut. The same thing happens as we approach the holidays. More price reductions are a sign that this market is finally beginning to shift.
Keep an eye on this number every week — if you see a sharp rise instead of a gradual climb, you’ll know the market is slowing.
Mike Simonsen is the Founder and CEO of Altos Research.


Once again great Insights from Mike Simonsen. Thank you!