Record high home prices continue to inch higher, even as homebuilders offer discounts and build a higher rate than pre-pandemic levels, according to a host of data releases over the last week.
Prices were highest in the South and West, the same regions in which builders are most active.
New home sales
The seasonally adjusted annual rate of new single-family home sales in October landed at 679,000, according to data published on Monday by the U.S. Census Bureau and the Department of Housing and Urban Development.
The figure – up 17.7% year-over-year – was dominated by the South, which the Census Bureau defines as 16 states spanning from Texas to Maryland. The region was responsible for almost 65% of the adjusted rate of home sales, up about 10 percentage points from the same month in 2018.
Homebuyers of new homes received some relief on prices, with the share of the annual rate of homes sold priced between $300,000-$399,000 growing more than five percentage points month-over-month to 34%. The median sales price for new homes likewise fell 3% to $409,300 from September.
Cutting prices is one of several mechanisms homebuilders have employed to keep buyers interested since rates began skyrocketing. Homebuilders are also pacing the number of homes they bring to market.
Home construction
New home construction ramped up early in the pandemic but moderated as interest rates ticked up and mortgage rates followed. That moderation continued in October, according to data published by the Census Bureau and HUD on Monday.
The seasonally adjusted annual rates of homes permitted, started, under construction and completed all remain well above pre-pandemic levels but below the peaks reached in the last three years. The rate of homes under construction has roughly plateaued since April 2022.
Builders seem to be prioritizing the South and West, with the seasonally adjusted annual rate of homes permitted per thousand residents highest in Idaho, North Carolina, Arizona, Florida and Texas and lowest in Rhode Island, Illinois, Alaska, New York and Connecticut.
Home prices
Nationally, home prices continue to inch upward, according to the S&P CoreLogic Case-Shiller Home Price Index published on Wednesday. The index, which pegs January 2000 at 100, reached a seasonally adjusted all-time high of 311.175 in September as tight inventory continues to keep prices elevated.
However, the price gains are hardly uniform across the 20 cities with their own indices. Miami led the nation at 423.19, while Detroit tallied the lowest index value at 180.54.
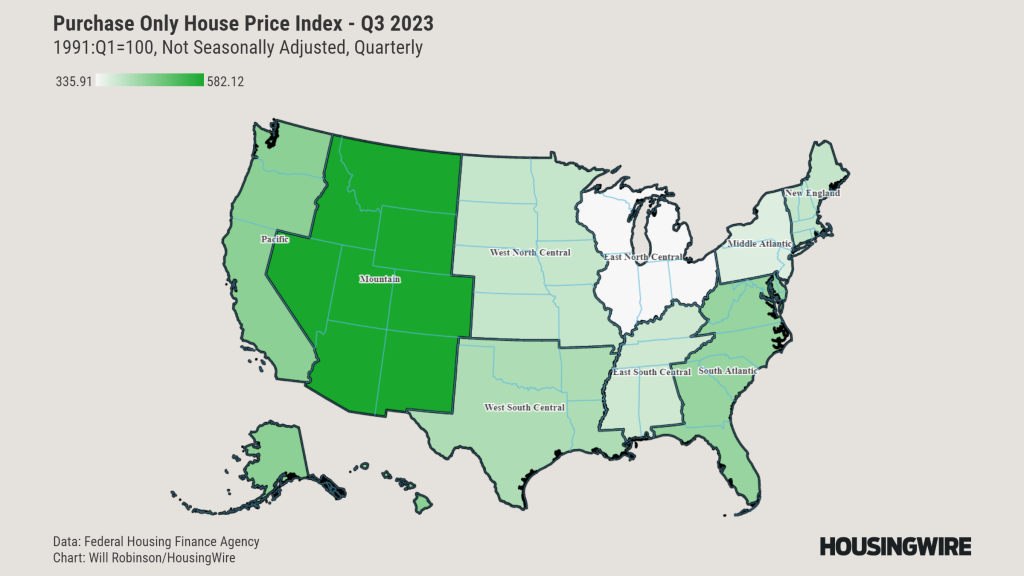
Similarly, the Federal Housing Finance Agency‘s Purchase-only House Price Index, which pegs January 1991 at 100, reached an all-time high of 414.76, and its gains, too, are geographically disparate.
The Census Bureau’s Mountain Division, which included eight states, has by far the highest index value in the country at 582.12 for the third quarter of 2023. By contrast, the East North Central Division, which includes Midwestern states like Michigan and Indiana, had the lowest value in the country at 335.91.


