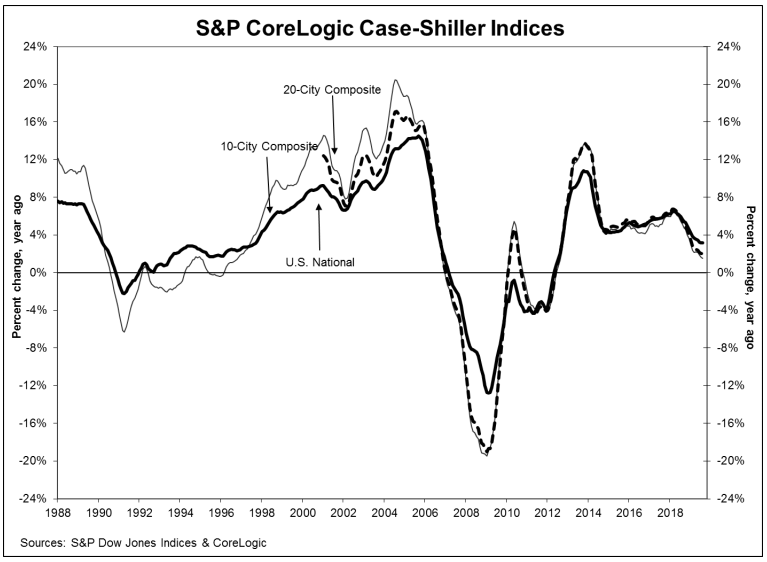
August 2019 saw an annual increase of 3.2% for home prices nationwide, inching forward from the previous month’s pace, according to the Case-Shiller Home Price Index from S&P Dow Jones Indices and CoreLogic.
The 10-City and 20-City composites reported a 1.5% and 2% year-over-year increase, respectively. During the month, 11 of 20 cities reported increases before seasonal adjustment, whereas 17 of 20 cities reported increases after seasonal adjustment.
“The U.S. National Home Price NSA Index trend remained intact with a year-over-year price change of 3.2%,” said Philip Murphy, Managing Director and Global Head of Index Governance at S&P Dow Jones Indices. “However, a shift in regional leadership may be underway beneath the headline national index.”
According to the index, Phoenix, Charlotte, and Tampa reported the highest year-over-year gains among all of the 20 cities.
In August, Phoenix led with a 6.3% year-over-year price increase, followed by Charlotte with a 4.5% increase and Tampa with a 4.3% increase. Seven of the 20 cities reported larger price increases in the year ending August 2019 versus the year ending July 2019.
“Phoenix saw an increase in its year over year price change to 6.3% and retained its leading position,” Murphy said. “However, Las Vegas dropped from No. 2 to No. 8 among the cities of the 20-City Composite, falling from a 4.7% year-over-year change in July to only 3.3% in August.”
“Meanwhile, the Southeast region included three of the top four cities. Charlotte, Tampa, and Atlanta all recorded solid year-over-year performance with price changes of 4.5%, 4.3%, and 4.0%, respectively,” Murphy said. “In the Northwest, Seattle’s year-over-year change turned positive (0.7%) after three consecutive months of negative year-over-year price changes. The 10-City Composite year-over-year price change declined slightly from July to 1.5%, while the 20-City Composite year-over-year price change remained steady at 2.0%. San Francisco was the only city to record a negative YOY price change (-0.1%).”
The graph below highlights the average home prices within the 10-City and 20-City Composites:


