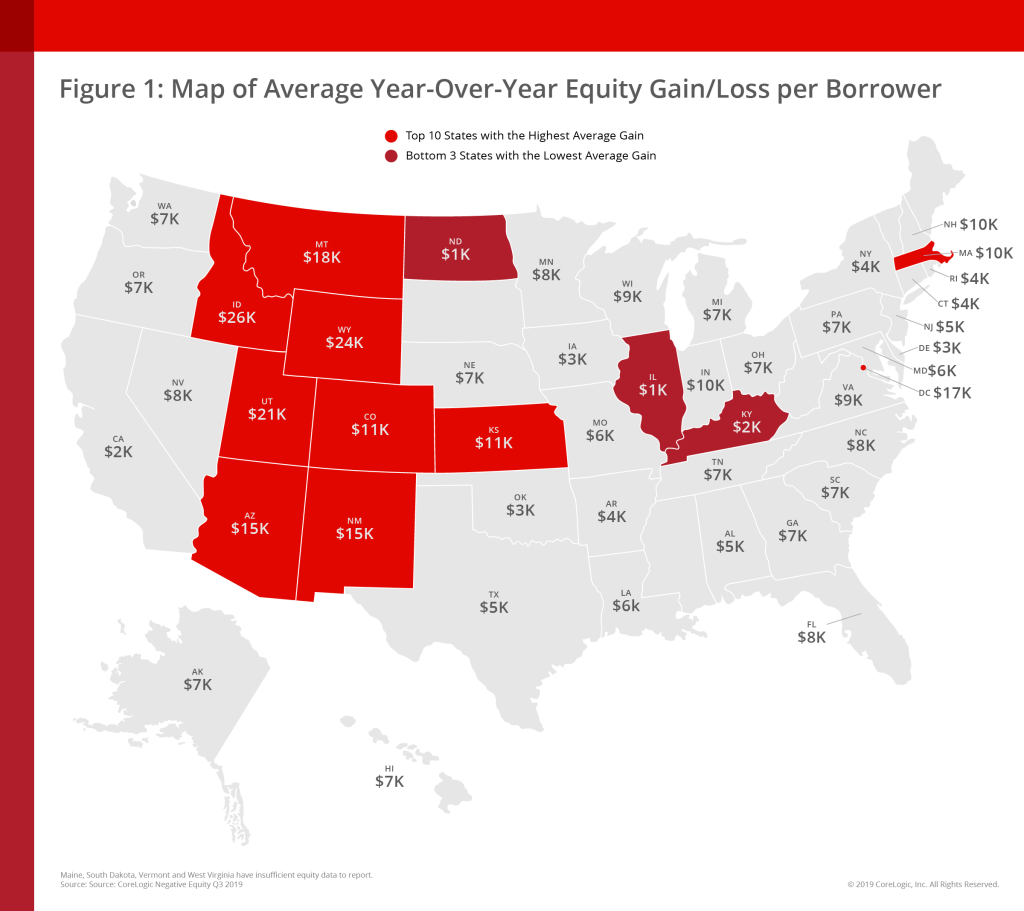
Homeowner equity continued to increase in the third quarter of the year, according to the Q3 2019 home equity analysis from CoreLogic, a property information, analytics and data-enabled solutions provider.
Homeowners with a mortgage – about 64% of all homeowners – saw their equity increase by 5.1%, a total of nearly $457 billion, since the third quarter of last year.
This means the average homeowner gained about $5,300 in equity in the last year.
Of all the nation’s housing markets, homeowners in Idaho experienced the largest gain in home equity. In this state, homeowners gained an average of $25,800.
This was followed by Wyoming, where homeowners gained an average of $24,000 and Utah, where homeowners gained an average of $21,000.
Across the country, the total number of mortgaged residential properties with negative equity decreased by 4% from the second quarter to 2 million homes or 3.7% of all mortgaged properties. This is a decline of 10% from 2.2 million homes in the third quarter of last year.
Frank Martell, CoreLogic’s president, and CEO said negative equity, which has fallen significantly throughout 2018, continues to decline thanks to the housing market’s rising home price appreciation.
“The negative equity share continues to decline thanks to rising home prices across the nation,” said Frank Martell, president, and CEO of CoreLogic. “According to the latest HPI report, home prices increased an average of 3.5% year over year in October 2019.”
According to CoreLogic, the value of negative equity in the U.S. at the end of the third quarter totaled approximately $301 billion. This is down $2.4 billion from $303.4 billion in the second quarter.
“Ten years ago, during the depths of the Great Recession, more than 11 million homeowners had negative equity or 25% of mortgaged homes,” said Frank Nothaft, CoreLogic’s chief economist. “After more than eight years of rising home prices and employment growth, underwater owners have been slashed to just 2 million, or less than 4% of mortgaged homes.”
This chart shows the equity growth of the nation’s largest housing markets:

NOTE: The CoreLogic HPI is based on public record, servicing and securities real-estate databases and incorporates more than 40 years of repeat-sales transactions for analyzing home price trends.


