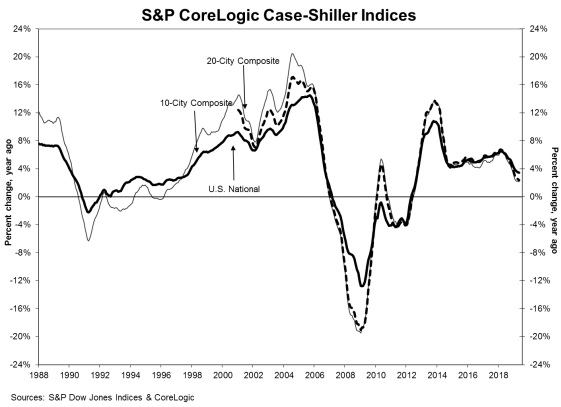
In May, the nation’s home-price gains continued to slow in many markets across the country, according to the latest Case-Shiller Home Price Index from S&P Down Jones Indices and CoreLogic.
May 2019 saw an annual increase of 3.4% for home prices nationwide, sliding from the previous month's pace of 3.5%, according to the report.
The graph below highlights the average home prices within the 10-City and 20-City Composites.
(Click to enlarge)
Before seasonal adjustment, the National Index increased 0.8% month over month in May. The 10-City Composite posted a 0.5% gain and the 20-City Composite increased 0.6% month over month.
After seasonal adjustment, the National Index recorded a month-over-month gain of 0.2% in May. Additionally, both the 10-City Composite and the 20-City Composite posted a 0.1% month-over-month increase.
The 10-City and 20-City composites reported a 2.2% and 2.3% year-over-year increase for the month, respectively. Before seasonal adjustment, 19 of 20 cities reported increases, while 13 of 20 cities reported increases after the seasonal adjustment.
S&P Dow Jones Indices Director and Global Head of Index Governance Philip Murphy said annual home price gains were lower in May than April, but not dramatically so and a broad-base moderation continued across the country.
“Though home price gains seem generally sustainable for the time being, there are significant variations between YOY rates of change in individual cities,” Murphy said. “Seattle’s home price index is now 1.2% lower than it was in May 2018, the first negative YOY change recorded in a major city in a number of years. On the other hand, Las Vegas and Phoenix, while cooler than they were during 2018, remain quite strong at 6.4% and 5.7% YOY gains, respectively.”
Las Vegas, Phoenix and Tampa once again reported the highest year-over-year gains among all of the 20 cities, according to the report.
In May, Las Vegas led with a 6.4% year-over-year price increase, followed by Phoenix with a 5.7% increase and Tampa with a 5.1% increase. Seven of the 20 cities reported larger price increases in the year ending May 2019 versus the year ending April 2019.
“Whether negative YOY rates of change spread to other cities remains to be seen; for now, there is still substantial diversity in local trends,” Murphy said. “Nationally, increasing housing supply points to somewhat weakened demand, but the fact that seven cities experienced stronger YOY price gains in May than they did in April suggests an underlying resiliency that may mitigate the risk of overshooting to the downside at the national level.”


