Home prices increased slightly in April, rising only 1% from March, according to the latest monthly House Price Index from the Federal Housing Finance Agency.
The FHFA monthly HPI is calculated using home sales price information from mortgages sold to, or guaranteed by, Fannie Mae and Freddie Mac. Because of this, the selection excludes high-end homes bought with jumbo loans or cash sales.
Capital Economics says this the second consecutive month of small monthly gains, and although inventory levels have remained at record lows, house price growth is being contained by subdued active housing demand. As interest rates continue to rise and mortgage lending stays tight, there will be a continual slowdown in annual price growth.
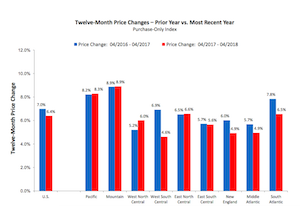
Monthly, across the nine census divisions, home price changes from March to April 2018 ranged from – 0.5% in the West South Central division to an increase of 0.6% in the East North Central division. Changes were all positive year over year, ranging from 4.6% in the West South Central division to 8.9% in the Mountain division.
The chart below compares 12-month price changes to the prior year:

(Source: FHFA)
Here are the states in each of the divisions:
West South Central: Oklahoma, Arkansas, Texas, Louisiana
East North Central: Michigan, Wisconsin, Illinois, Indiana, Ohio
Mountain: Montana, Idaho, Wyoming, Nevada, Utah, Colorado, Arizona, New Mexico
According to Capital Economics, low inventory will support prices for the rest of 2018. But the company says a sellers’ market will prevent rapid price growth, and it expects house prices to end 2018 around 5%.


