Home prices continued to increase in November, rising at a faster pace than the previous month, according to the latest report released by S&P Dow Jones Indices and CoreLogic.
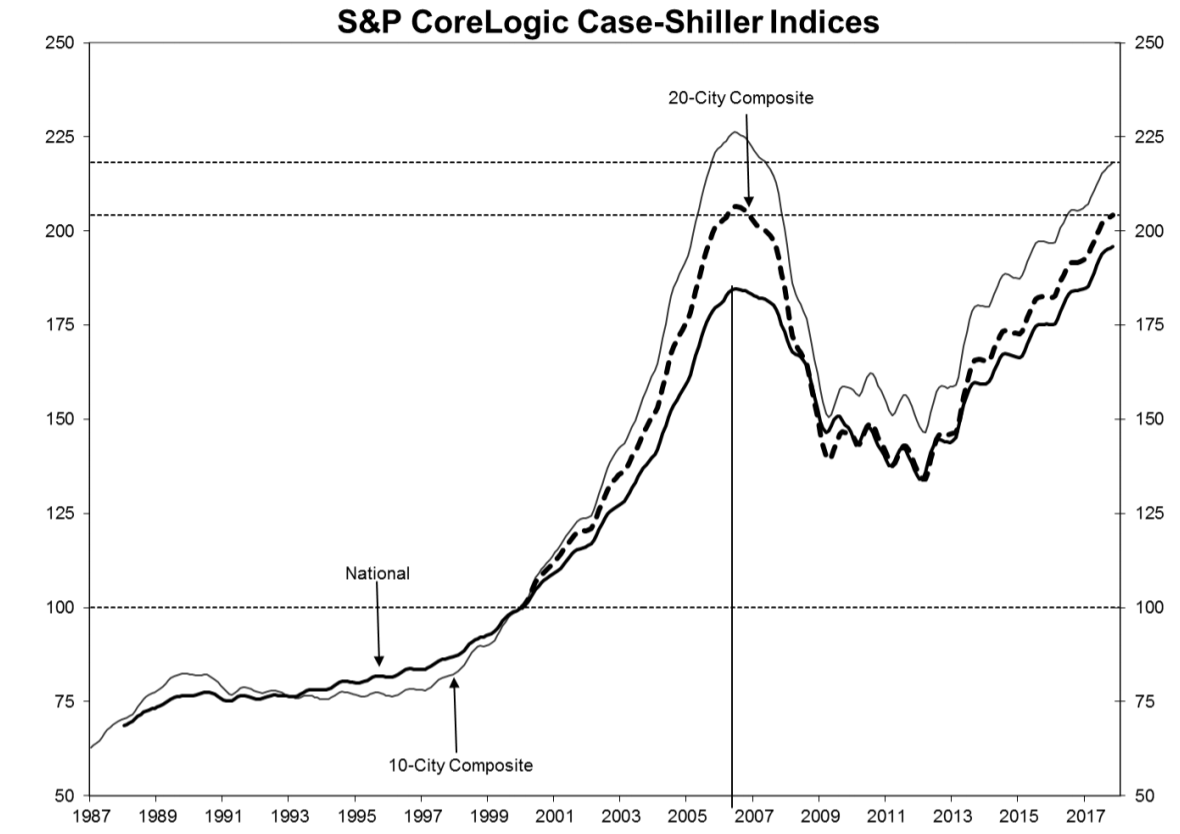
The S&P CoreLogic Case-Shiller U.S. National Home Prices NSA Index, which covers all nine U.S. census divisions, reported an increase of 6.2% in November. This is up from the annual increase of 6.1% the previous month.
The 10-City Composite held an annual increase of 6.1%, up from 5.9% the previous month. The 20-City Composite increased 6.4% year-over-year, up from the annual increase of 6.3% in October.
“Home prices continue to rise three times faster than the rate of inflation,” said David Blitzer, S&P Dow Jones Indices managing director and chairman of the index committee. “The S&P CoreLogic Case-Shiller National Index year-over-year increases have been 5% or more for 16 months; the 20-City index has climbed at this pace for 28 months.”
The chart below shows home prices continue to near all new highs, but have yet to surpass their 2006 levels.
Click to Enlarge
(Source: S&P Dow Jones Indices, CoreLogic)
Some cities saw higher increases than others. Seattle, Las Vegas and San Francisco reported the highest annual gains among the nation’s top 20 cities with increases of 12.7%, 10.6% and 9.1% respectively.
And one factor stands above the rest as being the main factor to the continually rising home prices.
“Given slow population and income growth since the financial crisis, demand is not the primary factor in rising home prices,” Blitzer said. “Construction costs, as measured by national income and product accounts, recovered after the financial crisis, increasing between 2% and 4% annually, but do not explain all of the home price gains.”
“From 2010 to the latest month of data, the construction of single family homes slowed, with single family home starts averaging 632,000 annually,” he said. “This is less than the annual rate during the 2007 to 2009 financial crisis of 698,000, which is far less than the long-term average of slightly more than one million annually from 1959 to 2000 and 1.5 million during the 2001 to 2006 boom years. Without more supply, home prices may continue to substantially outpace inflation.”
Monthly, the National Index increased 0.2% before seasonal adjustment in November. The 10-City and 20-City Composites increased 0.3% and 0.2% respectively before seasonal adjustment.
However, after seasonal adjustment, the National Index increased 0.7% from the previous month in November while the 10-City Composite increased 0.8% and the 20-City Composite increased 0.7%.
“Looking across the 20 cities covered here, those that enjoyed the fastest price increases before the 2007 to 2009 financial crisis are again among those cities experiencing the largest gains,” Blitzer said. “San Diego, Los Angeles, Miami and Las Vegas, price leaders in the boom before the crisis, are again seeing strong price gains.”
“They have been joined by three cities where prices were above average during the financial crisis and continue to rise rapidly – Dallas, Portland, Oregon, and Seattle,” he said.


