There haven’t been this many homes in foreclosure in New York City since the housing crisis, but the news isn’t quite as bad as it seems, a new report shows.
The report, from PropertyShark, a real estate data provider, shows that first-time foreclosures in New York City rose nearly 60% in 2017 to a level not seen since 2009.
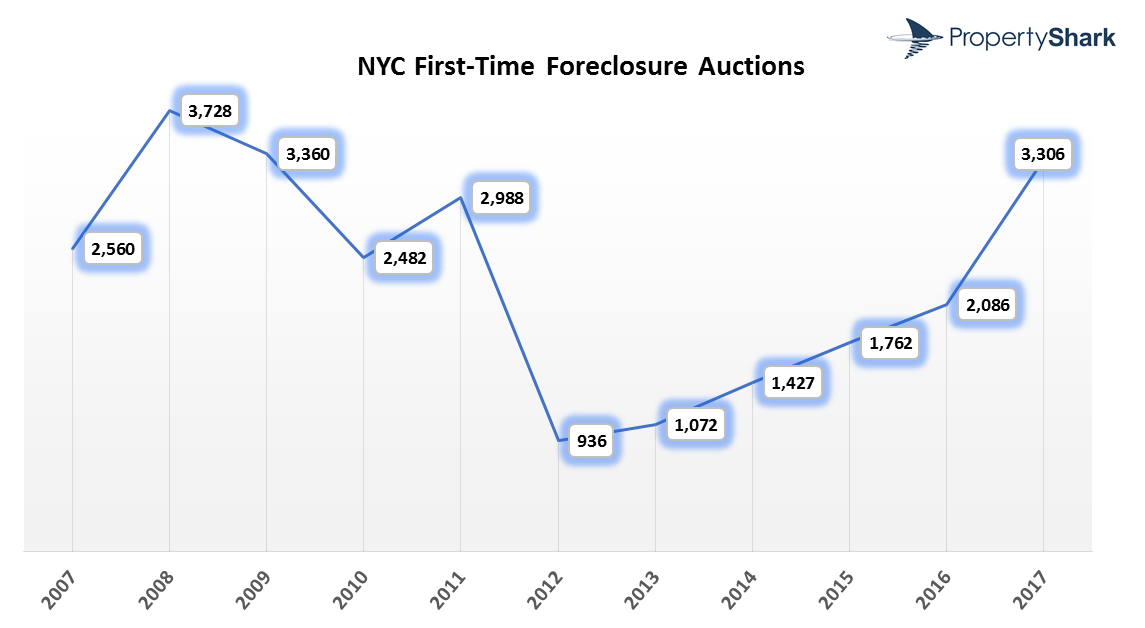
According to the report, there were 3,306 NYC homes scheduled for foreclosure auction in 2017, a 58% increase from 2,086 homes that were scheduled for foreclosure during 2016.
Overall, last year’s total of 3,306 new foreclosures was the third highest in the last decade. Only 2008, with 3,728 new foreclosures, and 2009, with 3,360 new foreclosures, ranked higher over the last 10 years.
As the chart below shows, foreclosures have been on the rise in New York City over the last several years, climbing steadily since 2012 before exploding last year.
(Click to enlarge. Image courtesy of PropertyShark)
But these foreclosures aren’t new. In fact, many of them have been in the works for many years. Readers of HousingWire shouldn't be surprised, back in 2011 we reported that S&P said the shadow inventory in the state wouldn't clear up until 2022, at the least.
Of all homes that reached the foreclosure auction stage in 2017, the majority had their lis pendens notice, the legal filing that marks the beginning of the foreclosure process, filed in 2013-2014, when there was an increased number of cases filed in the city.
Additionally, around 20% of the homes scheduled for auction in 2017 received their initial lis pendens notice in 2009 and 2010 at the peak of the housing crisis.
According to PropertyShark’s report, foreclosures increased in almost every borough of New York City, with the exception of Manhattan, where foreclosures were “almost flat” year-over-year.
Each of the other boroughs saw foreclosures rise.
In Brooklyn, new foreclosure auctions doubled from 2016 to 2017. In fact, the 827 Brooklyn homes that were scheduled to be auctioned in 2017 was the highest that figure has been in 10 years.
Staten Island saw the most significant increase in foreclosures in the last year, rising 134% over 2016. There were 428 foreclosures in Staten Island in 2017, compared to 183 in 2016.
Foreclosures also rose in Queens and the Bronx, but by smaller margins than in Brooklyn and Staten Island.
According to PropertyShark’s report, Queens continued to have the highest number of homes in foreclosure of all the NYC boroughs, with 1,260 new foreclosures in 2017. That was an increase of 40% from 2016’s total of 898 new foreclosures.
Foreclosures in the Bronx rose by 44% in 2017, climbing from 451 in 2016 to 650 in 2017.
As another indication of how long the foreclosure process takes in New York City, there were 12,072 lis pendens filings recorded in 2017, which was actually a 4% year-over-year decrease.
(Click to enlarge. Image courtesy of PropertyShark)
Over the last decade, only 2011 had fewer pre-foreclosure cases filed, with 10,911, than 2017 did.
PropertyShark’s report covers single- and two-family homes, and condo and co-op units.


