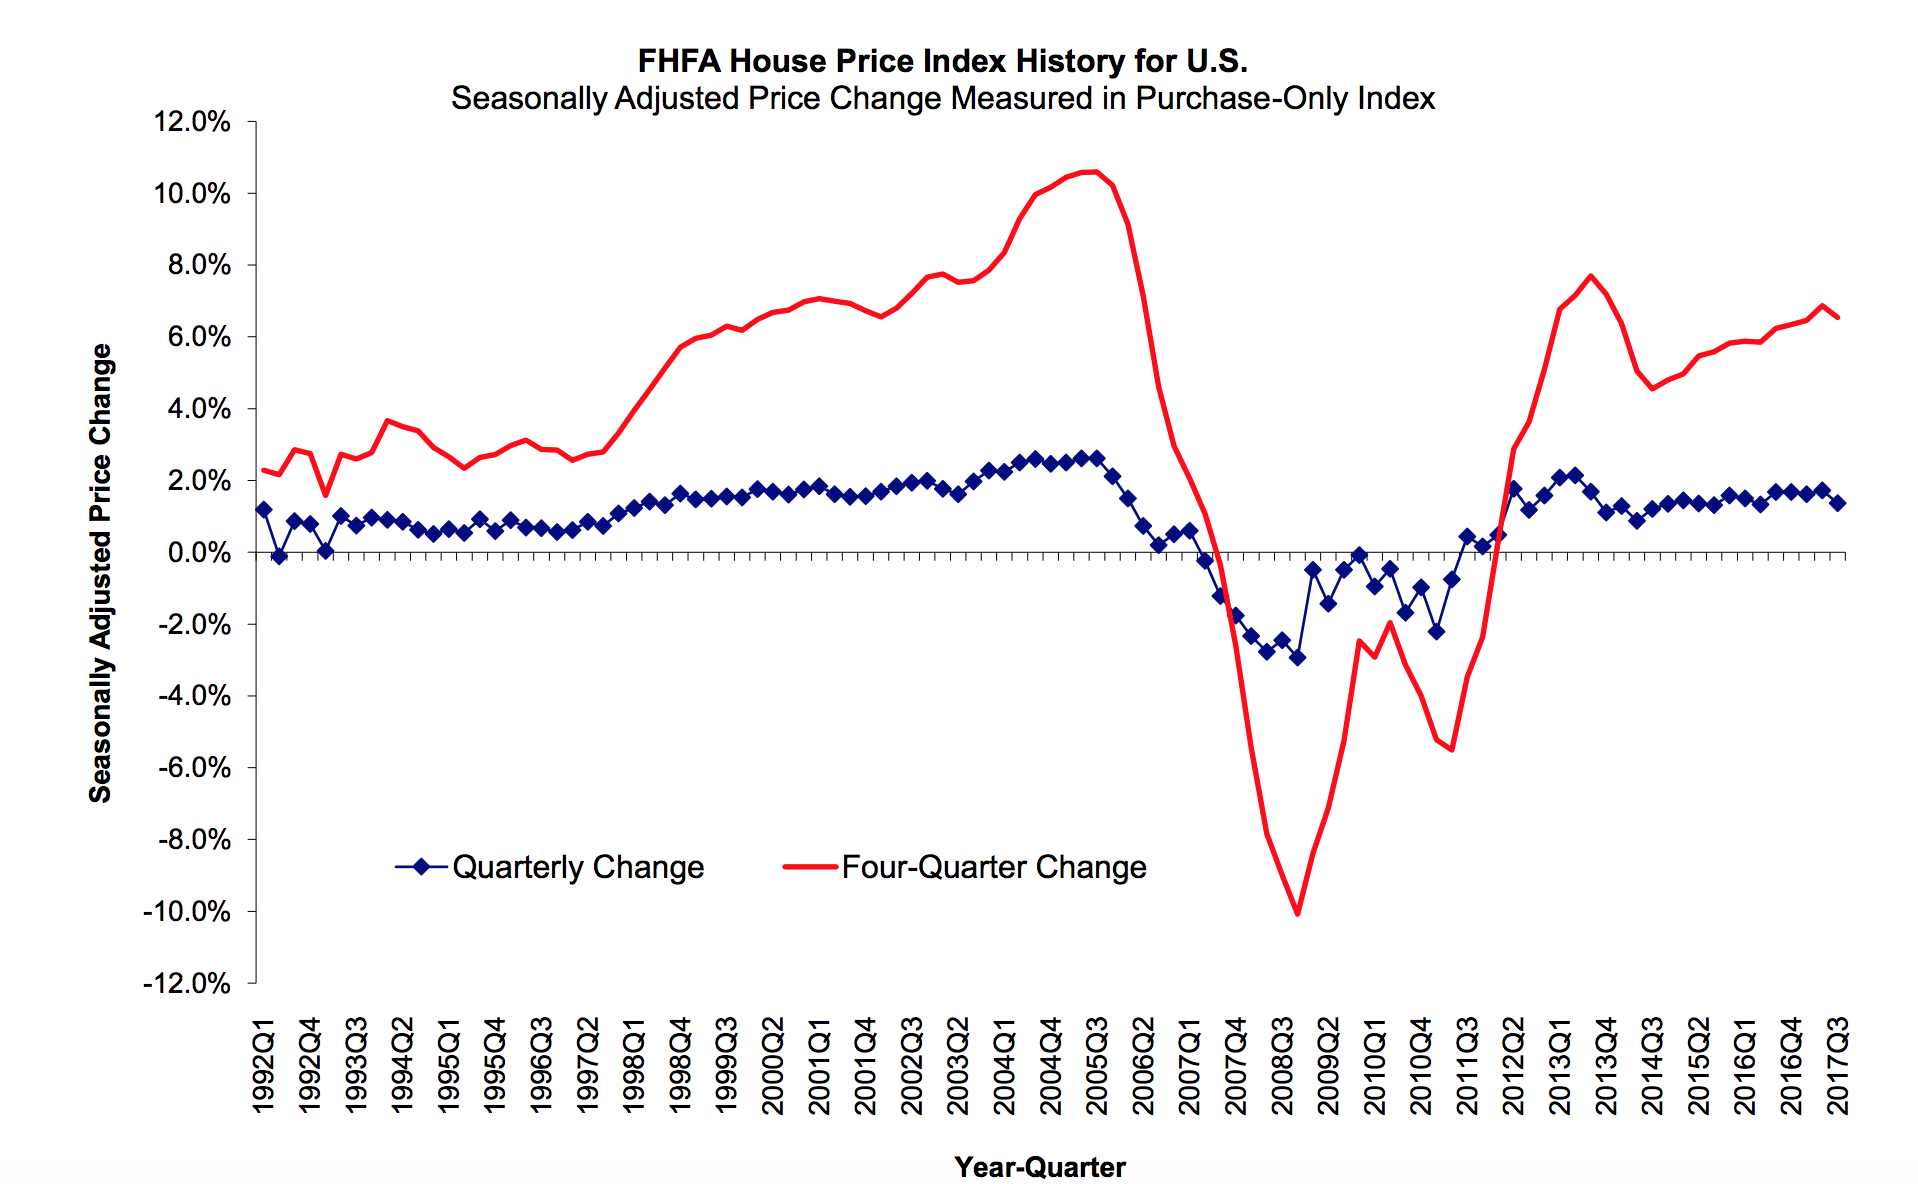
Home prices increased 1.4% in the third quarter this year, but increases slowed from August to September, according to the latest House Price Index from the Federal Housing Finance Agency.
Home prices increased 0.3% in September, hitting yet another all-time peak, but slowing slightly from its increase of 0.7% in August. Annually, home prices increased 6.5% from the third quarter 2016 to the third quarter of 2017.
The chart below shows the percentage of home price changes dating back to 1992. The chart shows that since 2014, home price increases have picked up the pace, rising at faster rates.
Click to Enlarge
(Source: FHFA)
The FHFA monthly HPI is calculated using home sales price information from mortgages sold to, or guaranteed by, Fannie Mae and Freddie Mac. Because of this, the selection excludes high-end homes bought with jumbo loans or cash sales.
“With relatively favorable economic conditions and a continued shortage of housing supply, price increases in the third quarter were generally robust and widespread,” FHFA deputy chief economist Andrew Leventis said. “At some point, declining housing affordability should temper appreciation rates in some of the nation’s fastest appreciating markets, but our third quarter results show few signs of that.”
But FHFA isn’t the only one reporting home price increases in September. Home prices increased in September at their fastest pace in more than three years, according to the latest S&P CoreLogic Case-Shiller Indices released by S&P Dow Jones and CoreLogic. The Case-Shiller report showed home prices increased 0.4% monthly and 6.2% from last year.
The states with some of the highest increases in home prices include the District of Columbia, with an increase of 11.6%, Washington at 11.5%, Hawaii at 10%, Arizona at 10% and Nevada at 9.6%.
In fact, the FHFA’s HPI found that home prices increased in each of the 100 largest metropolitan areas over the last four quarters. Annual increases were the highest in the Seattle area, where they rose 14.6%. Price increases were the lowest in Camden, New Jersey, where they increased just 0.5% from last year.
Regionally, home prices ranged from an increase of 8.9% annually and 1.7% from the second quarter in the Pacific region to an increase of 4.8% annually in the Middle Atlantic region.
Here is a list of which states are in each of those divisions:
Pacific: Hawaii, Alaska, Washington, Oregon, California
Middle Atlantic: New York, New Jersey, Pennsylvania


