Speaking before a packed house gathered Wednesday on the 7th floor of the Newseum in Washington, D.C., CoreLogic’s chief economist, Frank Nothaft, told the crowd of housing insiders that anyone waiting for any dramatic shifts in housing, interest rates, or otherwise is likely to be left waiting.
Nothaft, speaking at the "Data, Demand, and Demographics: A Symposium on Housing Finance" presented by the Urban Institute and CoreLogic, told the crowd that housing is entering a new normal.
And that new normal means interest rates will be staying low, well below 5% for the next several years, amid shifting demographics bringing new homebuyers to the market.
“I think mortgage rates are going to be with us for a long period of time,” Nothaft said. “The expectation in capital markets is no rate change from the Federal Open Markets Committee today. We may see an increase in federal funds rate in December.”
Nothaft added that Wednesday’s FOMC announcement could provide more of an indication on the willingness of FOMC members to increase rates before the year is out.
But even if the FOMC does raise rates, mortgage interest rates will stay low, Nothaft said, but perhaps not as “dirt cheap” as they are right now.
“I think we’ll see rates rise from dirt cheap to a very low level as we move into next year, still remaining below 4% all through next year,” Nothaft said. “We’re evolving into a new era in mortgage rates.”
Nothaft also projects four other trends that will emerge over the next several years that will shape housing’s new normal.
Chief among those is a shift in household composition and a change in demographics as more Millennials approach homebuying age.
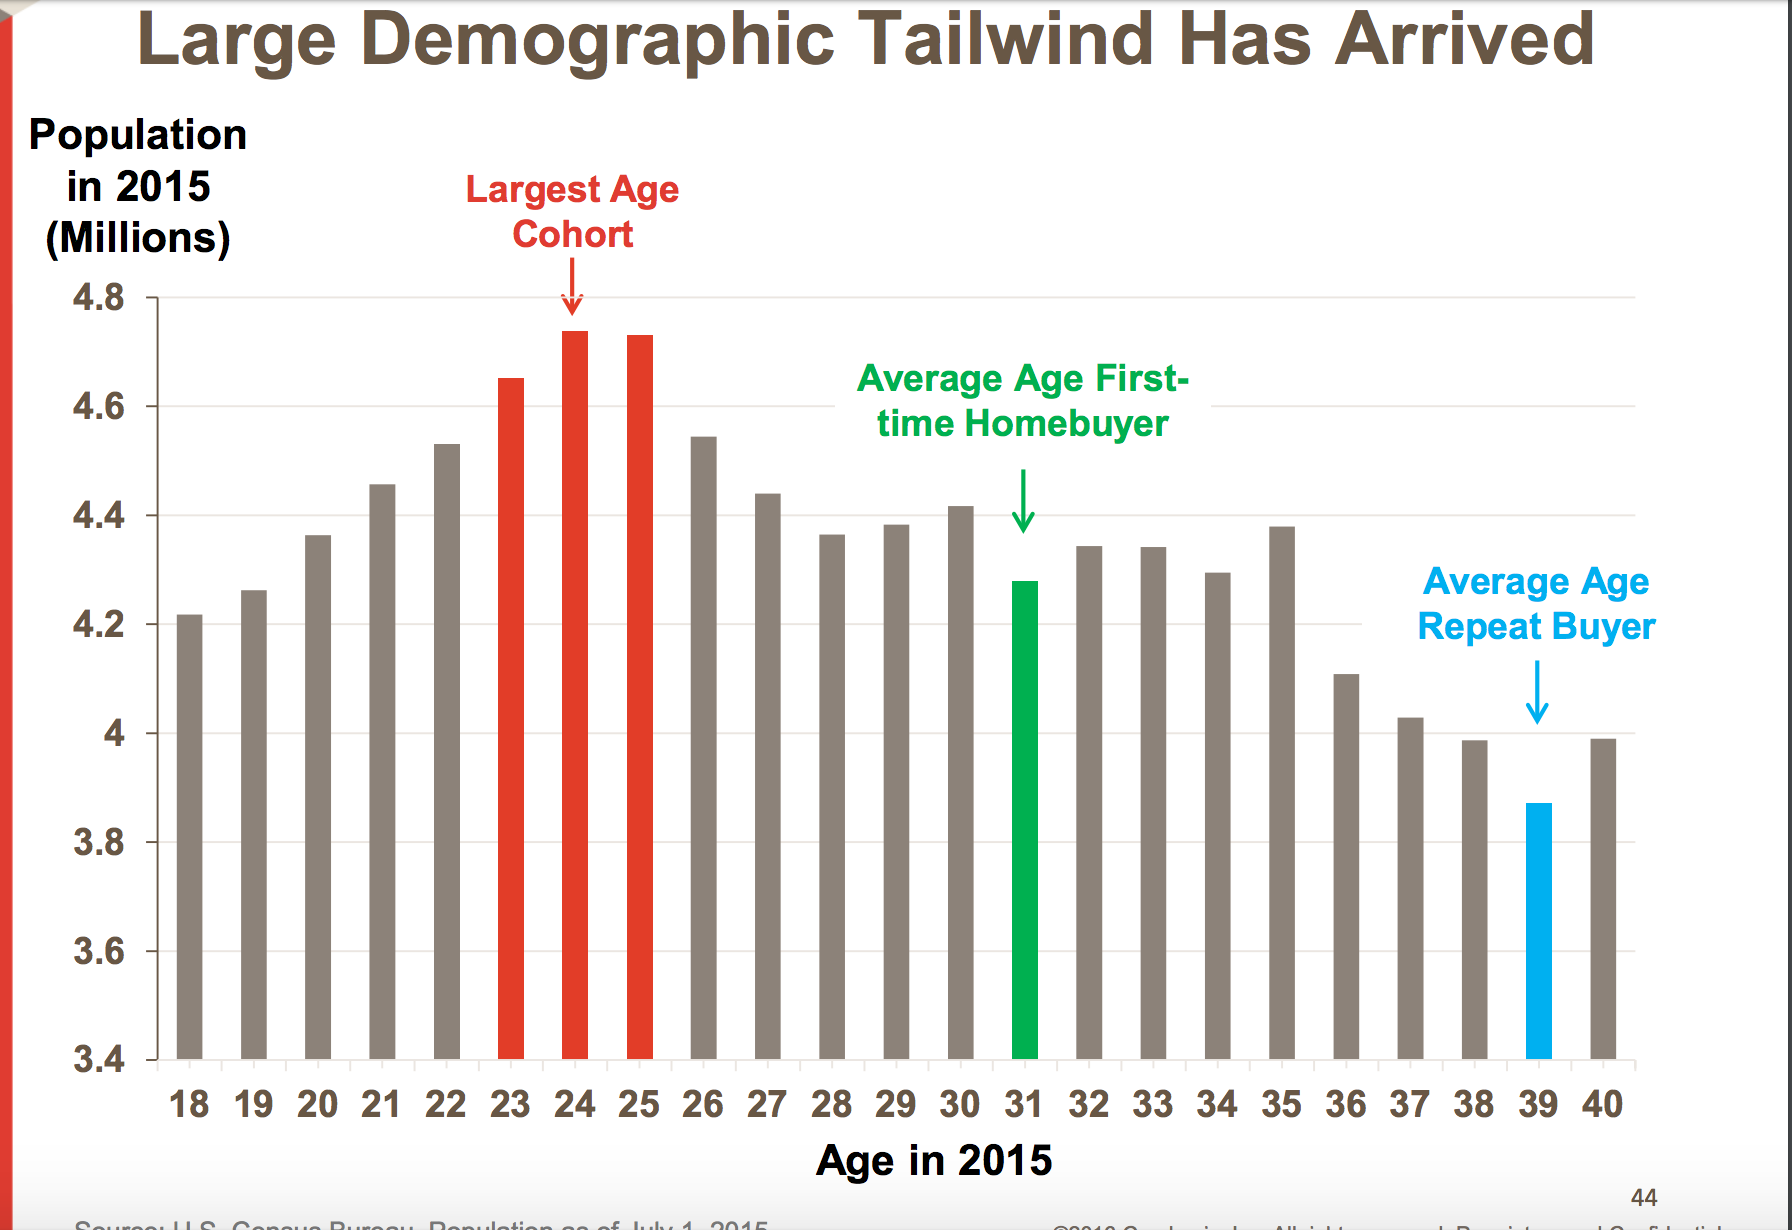
Nothaft presented a chart during his presentation that highlighted the difference between the largest age cohort in the U.S. population, ages 24 and 25, and the average age of the first-time homebuyer, which is 31.
The bottom line: Millennial buyers are coming, and they’re coming relatively soon.
Click the image below for a graphic breakdown of population age.
(Chart courtesy of CoreLogic and the Urban Institute)
Nothaft also pointed to the shift in demographics as to where the new buyers are coming from, outside of the coming wave of Millennials.
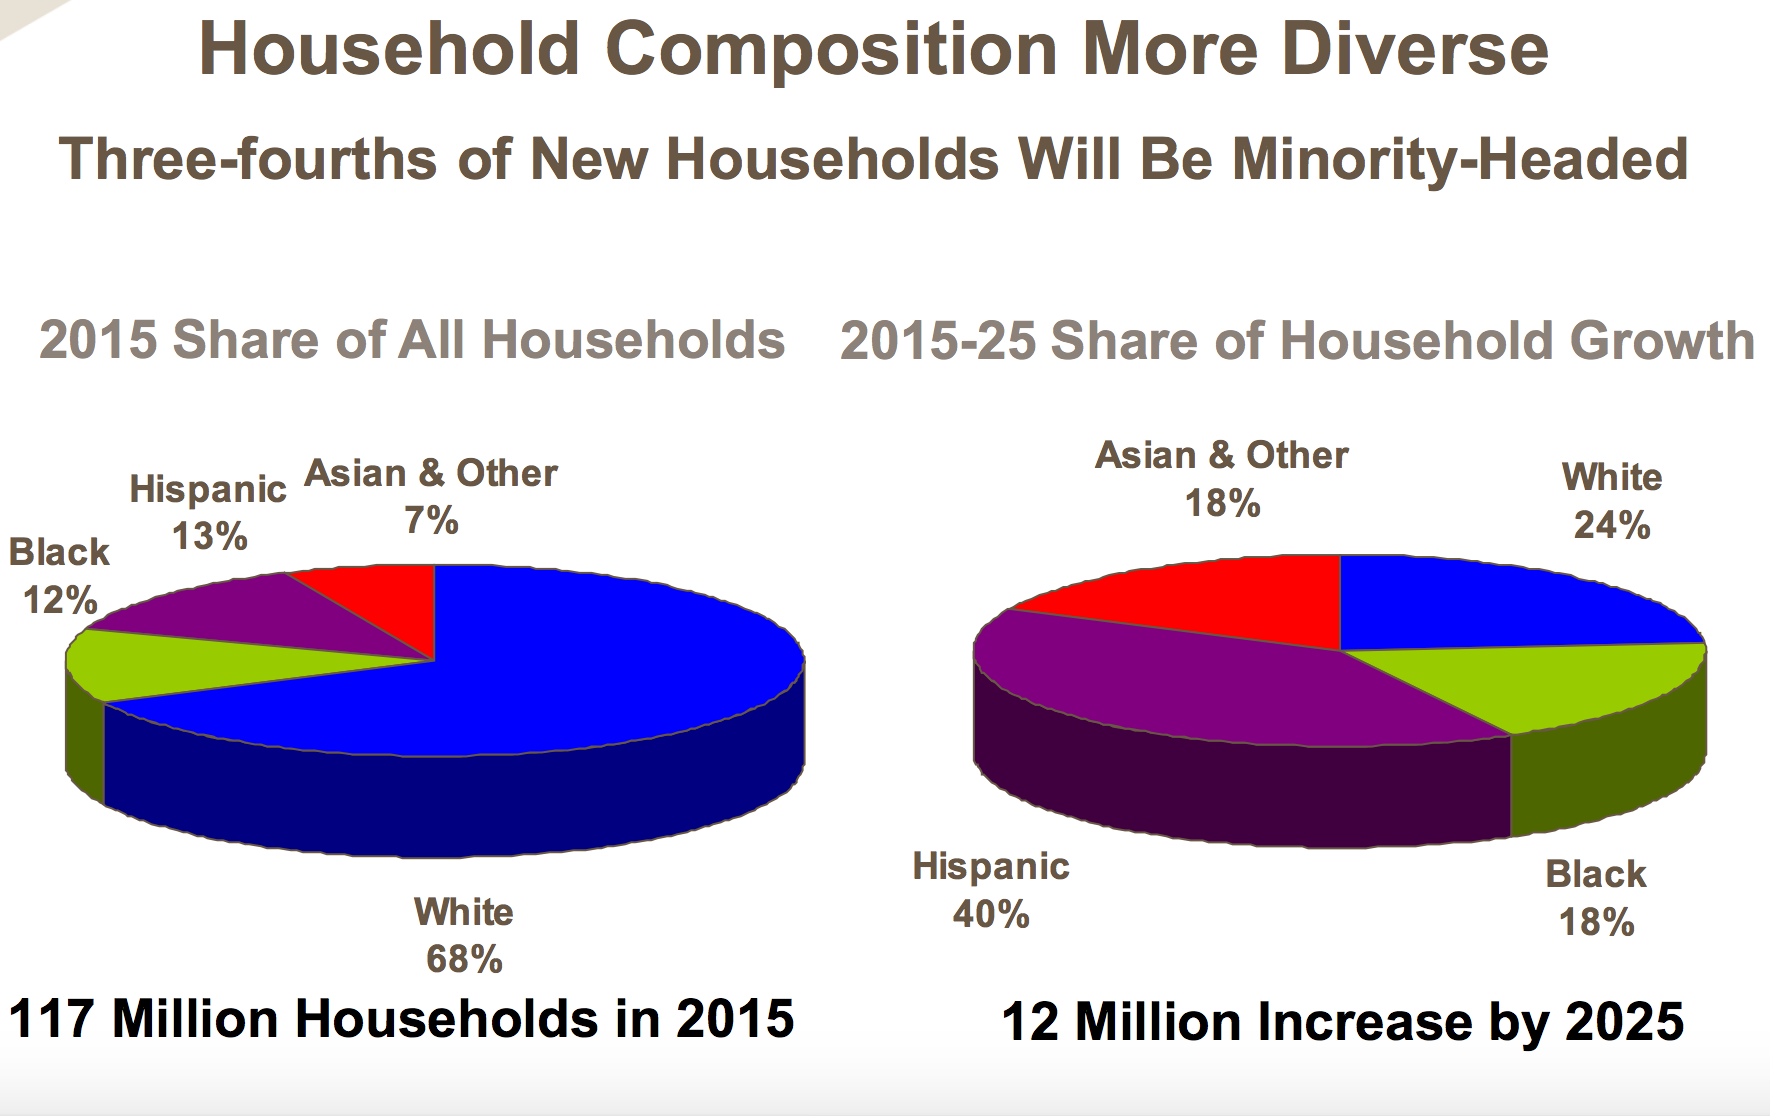
According to Nothaft, over the next 10 years, three-fourths of new households will be minority-headed.
To further illustrate that, Nothaft provided the percentage breakdown of all households in 2015. Among the 117 million households in 2015, 68% of those are white households, while 13% are Hispanic, 12% are black, and 7% are Asian or others.
For the next 10 years referenced, 2015-2025, the household formation will shift to minorities, as 40% of the share of household growth during that time period will be from Hispanics, while 24% will come from whites, and 18% will come from each blacks and Asians.
Click the below above for a demographic breakdown of household formation.
(Chart courtesy of CoreLogic and the Urban Institute)
Another segment of the new normal for housing is that home sales will contines to rise. However, homeowners holding onto their homes and not moving up or moving out will place constraints on that growth.
Additionally, Nothaft stated that purchase mortgage originations and new home equity lines of credit will dominate mortgage originations over the next several years as refinances fall back as interest rates increase slightly.
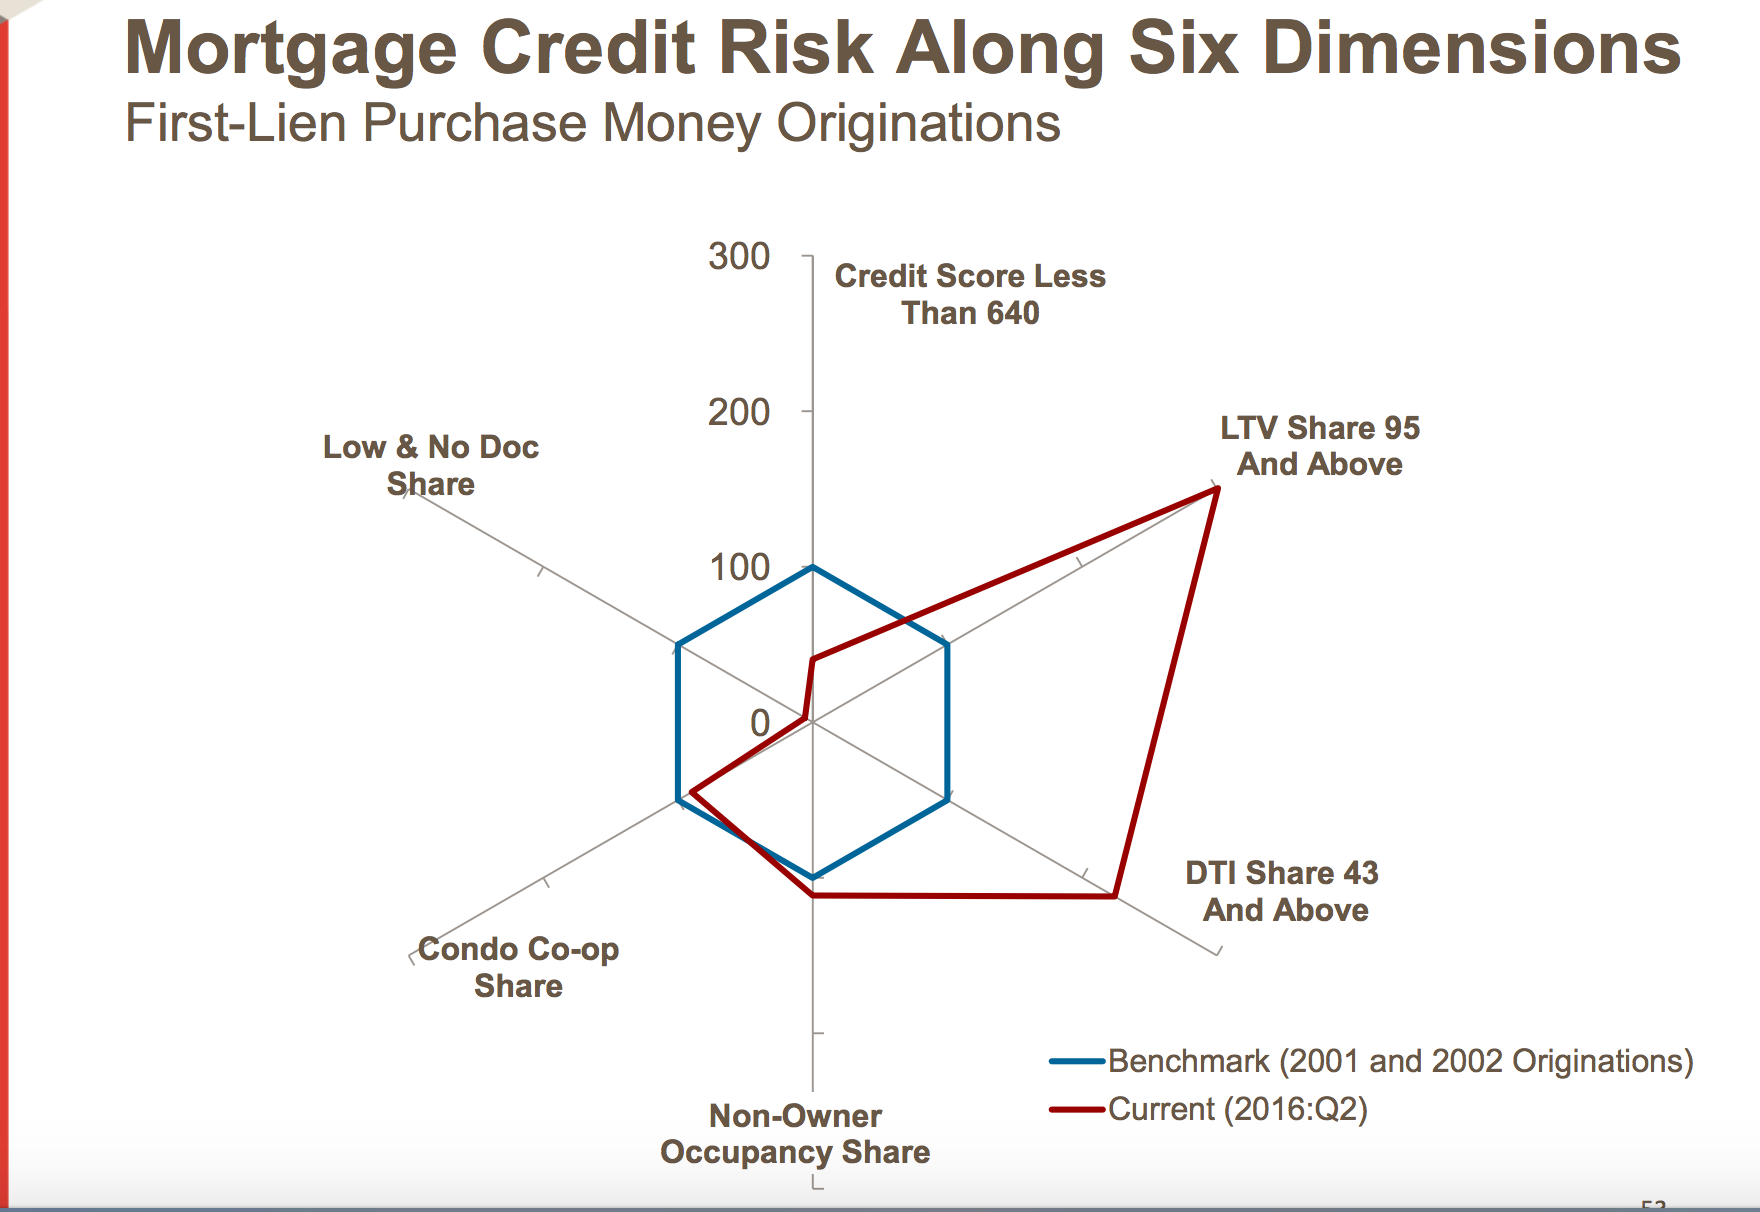
Nothaft also cited the “excellent” performance of mortgages since the crisis as the new credit profile, which brings much lower credit risk than before the crisis.
While loans with loan-to-value ratios above 95% and loans with debt-to-income ratios at 43% or above are on the rise, that’s counterbalanced by the prevalence of loans with much higher credit scores and the complete dearth of low- and no-document loans.
Click the image below for a breakdown of credit risk currently.
(Chart courtesy of CoreLogic and the Urban Institute)


