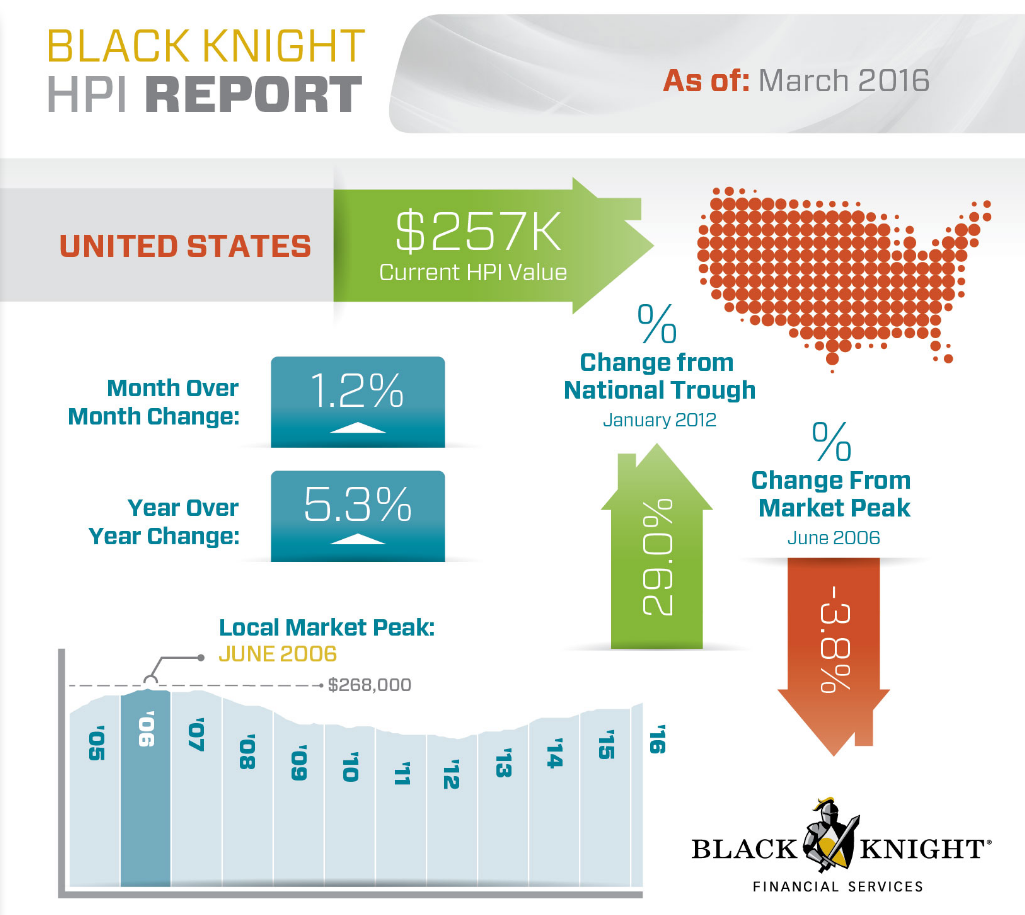
Home prices nationwide increased in February, albeit a slight 1.2% increase, with the four largest states staying within the same range, according to Black Knight’s March Home Price Index report. This is up 5.3% on a year-over-year basis and continues a long-time trend of rising home prices
Black Knight’s Home Price Index report uses repeat sales data from the ‘nation’s largest’ public records data set as well as its loan-level mortgage performance data.
The Black Knight HPI provides micro-level valuation data by covering nearly 90% of U.S. residential properties at the ZIP-code level in both disclosure and non-disclosure states.
As a result, national home prices are now up 29% since the market's bottom in January 2012, and at $257,000, the national level HPI is now just 3.8% off its June 2006 peak of $268,000.
This chart gives an overview of the nation’s home prices.
Click to enlarge
(Source: Black Knight)
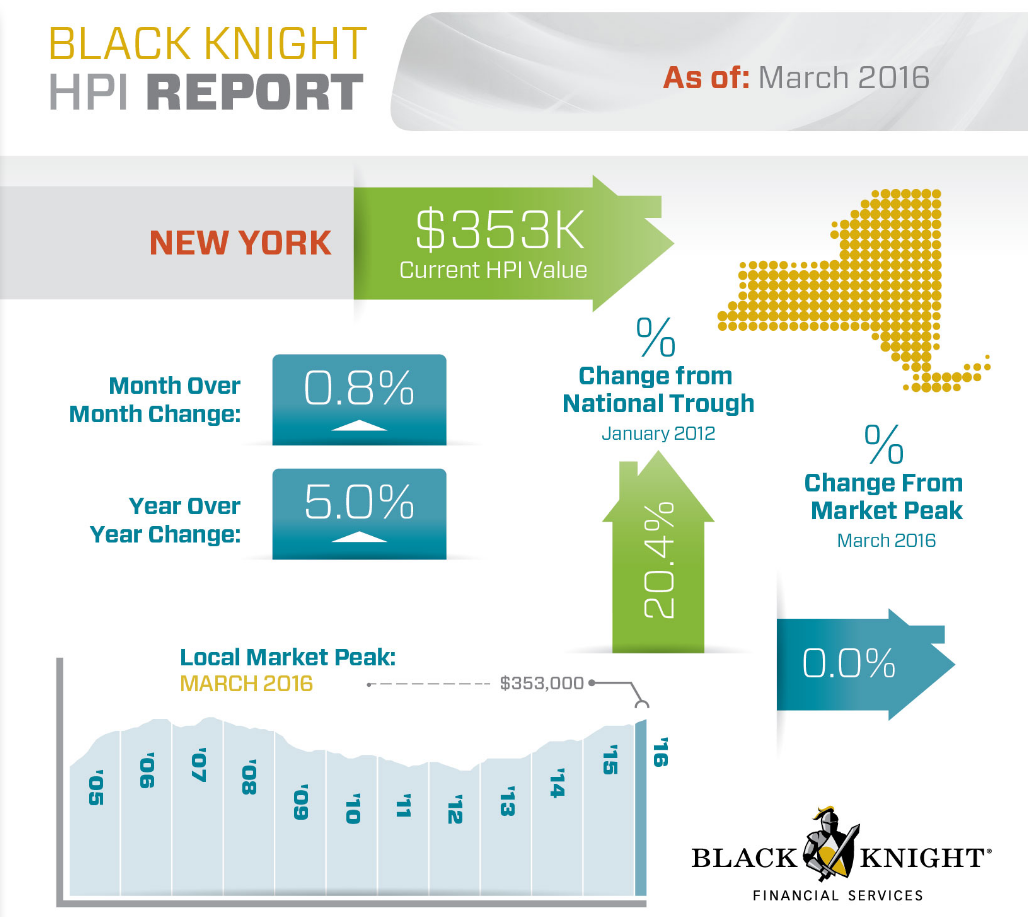
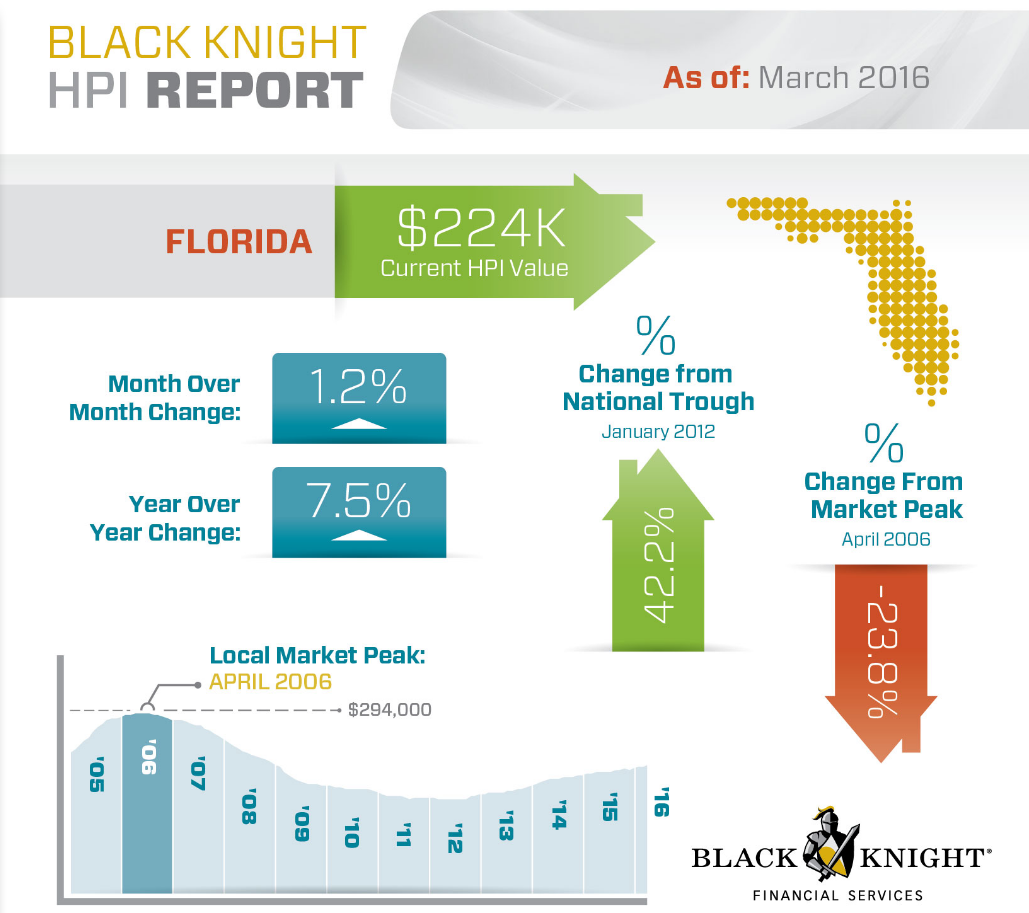
Here’s an extra break down of home prices in the four largest states:
New York:
Click to enlarge
(Source: Black Knight)
Florida:
Click to enlarge
(Source: Black Knight)
Texas:
Click to enlarge
(Source: Black Knight)
California:
Click to enlarge
(Source: Black Knight)


