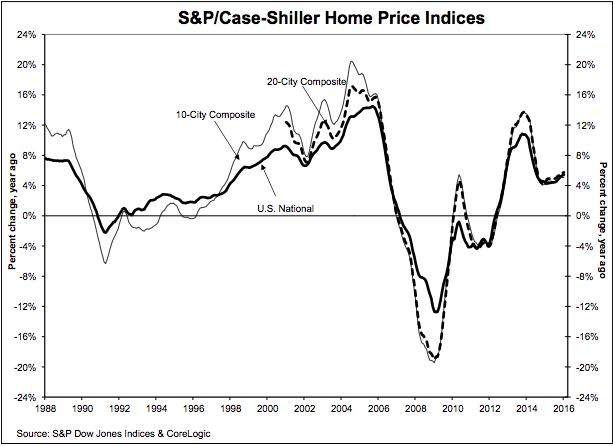
According to the latest S&P/Case-Shiller U.S. National Home Price Index, prices in 20 major metropolitan areas increased to 5.7% in January from the previous year.
“Home prices continue to climb at more than twice the rate of inflation,” says David M. Blitzer, Managing Director and Chairman of the Index Committee at S&P Dow Jones Indices.
“The low inventory of homes for sale — currently about a five-month supply – means that would-be sellers seeking to trade-up are having a hard time finding a new, larger home. The recovery of the sale and construction of new homes has lagged the gains seen in existing home sales. This may be starting to change: starts of single family homes in February were the highest since November 2007. The single-family-home share of total housing starts was 70% in February, up from a low of 57% in June 2015, and approaching the 75%-80% range seen before the housing crisis,” added Blitzer.
The 10-City Composite is up slightly at 5.1% for the year. The 20-City Composite’s year-over-year gain is 5.7%. After seasonal adjustment, the National, 10-City Composite, and 20-City Composite rose 0.5%, 0.8%, and 0.7%, respectively, from the prior month.
Portland, Seattle, and San Francisco reported the highest year-over-year gains among the 20 cities with another month of double digit annual price increases. Portland led the way with an 11.8% year-over-year price increase, followed by Seattle with 10.7%, and San Francisco with a 10.5% increase. Eleven cities reported greater price increases in the year ending January 2016 versus the year ending December 2015. Phoenix reported an annual gain of 6.1% in January 2016 versus 6.3% in December 2015, ending its streak of 12 consecutive months of increasing annual gains. The western part of the country saw the largest price gains in the past year; the northeast is the weakest region.
Month-over-month, before the seasonal adjustment, the National, the 20 and the 10 city composites all remained the same in January.
According to CNBC:
Zillow Chief Economist Svenja Gudell said lower-income buyers are having a tough time finding a home that matches their needs and budgets, but there is not much to worry about in housing when one looks at the big picture.
"Economic growth hasn't been overwhelming, but it has been consistent, and as long as wages and job opportunities keep rising, the housing market should remain fairly stable and healthy," she said in a statement.
Click to enlarge
(Source: Case-Shiller)
“The pace of U.S. home value growth has been picking up bit-by-bit over the past few months, driven in large part by stubbornly low inventory in most markets that creates competition and drives up prices for those homes that are available,” said Gudell.
“This does create some challenges for home buyers, particularly first-time and lower-income buyers, struggling to find a home that fits both their needs and budget. But looking at the bigger picture, there’s not much else to worry about in housing at the moment. Economic growth hasn’t been overwhelming, but it has been consistent, and as long as wages and job opportunities keep rising, the housing market should remain fairly stable and healthy,” concluded Gudell.
Home prices posted a slightly higher year-over-year gain with a 5.4% annual increase in December 2015 versus a 5.2% increase in November 2015. Causing housing in dire need of inventory.


